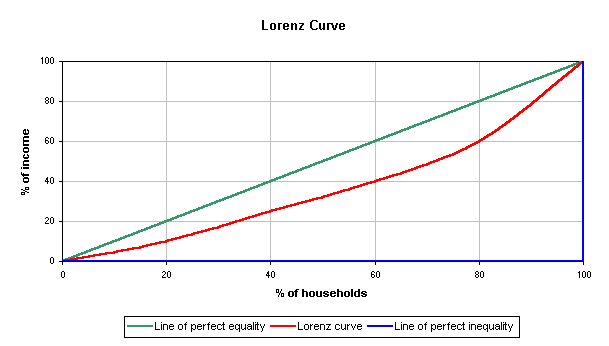
The Gini coefficient is an economic measurement of income inequality in a given society. It’s a number drawn from an economic model called the Lorenz curve, which is a linear representation of the relationship between households and income. In essence, the Lorenz curve is a graph where every point in the curve tells us the answer to the question “what percentage of households have a given percentage of national income”? Above is a good example from Wikipedia.
If income was perfectly even in its distribution, the Lorenze curve would be the green line shown above because there would be a 1:1 ration of households and income (i.e. x=y in that 10 percent of households would have 10 percent of the income, 26 percent of households would have 26 percent of the income, etc). If one person has all the income and no one else has any, than we get the blue line where only the 100th percentile of income earners—this one hypothetical mogul—owns 100 percent of the income.
So the Gini coefficient is a measure of the degree to which the relationship between households and incomes for a given society diverges from the green line (perfect equality) and resembles the blue (perfect inequality). It's calculated thusly:
divided by
the total area of the region below the red line.
The higher this resultant fraction is (so, the bigger the 'distance' between the red line and the green line), the more unequal a society is in terms of income distribution. The US has always had a bigger tolerance for inequality than most other advanced nations (aka has a higher Gini coefficient).
The Gini coefficient has also been steadily rising for thirty years. But it's increase hasn't been even across administrations. From 1993 to 1999, the US Gini coefficient grew by .003, which breaks down to an increase of about .0004 per year. From 2000 to 2005, the Gini coefficient grew by .009--three times as much as in the 1990s.
Let’s say that the Gini coefficient grows at the accelerated rate that it has been since 2000—by .009 every six years. In thirty years, the number would increase by .054, to .523. That would make the